Introduction Link to heading
If you haven’t heard of The One Billion Row Challenge, it’s a fun contest in which participants are asked to write a computer program that would parse a one billion line long text file and aggregate that data in the fastest way possible. This, of course, has very little to do with real life coding, but, nevertheless, it is a highly entertaining exercise in performance optimization.
The input data looks like this:
Hamburg;12.0
Bulawayo;8.9
Palembang;38.8
St. John's;15.2
Cracow;12.6
Bridgetown;26.9
Istanbul;6.2
Roseau;34.4
Conakry;31.2
Istanbul;23.0
The task is to read it and compute basic statistics (min, mean, max) for each weather station. The repository linked above comes with a Java program that generates the test data. In my case, the size of the generated file was 13,795,355,507 bytes.
Presumably, we would need to read each line of the input at least once. How fast can this possibly be done on a modern computer?
For the purpose of this post, let’s focus on even simpler problem than The One Billion Row Challenge and go through the steps of optimizing a program that only counts the new line bytes.
Setting a target to beat Link to heading
Counting new lines? That sounds like something wc would be good at! And indeed it is:
> time wc -l /home/malor/sandbox/1brc/measurements.txt
1000000000 /home/malor/sandbox/1brc/measurements.txt
________________________________________________________
Executed in  926.97 millis    fish           external
   usr time  172.55 millis    0.00 micros  172.55 millis
   sys time  751.80 millis  835.00 micros  750.97 millis
Just under a second to count one billion new lines in a ~13 GiB text file! Not bad!
There are two important observations to make here:
The very first run is slow, but all the subsequent ones are much faster. If your machine has 32 GiB of RAM or more, chances are that the kernel will have the entirety of this file cached in memory, which removes the storage layer out of the equation.
If the data is in main memory, and there is no I/O happening, why does wc spend more time in kernel space than in user space? We’ll come back to this later to understand what exactly it is doing.
Let’s see if we can write a program that will do it faster.
Naive implementation Link to heading
If you were new to Rust, you could create a trivial implementation like this:
fn count_lines(path: &str) -> Result<usize> {
    let mut reader = BufReader::new(File::open(path)?);
    let mut lines = 0;

    let mut buf = String::new();
    loop {
        if reader.read_line(&mut buf)? == 0 {
            break;
        }

        lines += 1;
    }

    Ok(lines)
}
Unfortunately, its performance is nowhere near wc, and our version is ~28 times slower!
> time target/release/newlines /home/malor/sandbox/1brc/measurements.txt
1000000000 /home/malor/sandbox/1brc/measurements.txt
________________________________________________________
Executed in   27.93 secs    fish           external
   usr time   22.24 secs    0.00 micros   22.24 secs
   sys time    5.35 secs  687.00 micros    5.34 secs
This function has multiple different issues, and some of those might already be obvious to you, but it’s always a good idea to use a profiler instead of trying to guess.
$ perf record -F 99 --call-graph dwarf target/release/newlines -- \
     /home/malor/sandbox/1brc/measurements.txt
perf is a statistical profiler that expects you to specify the sampling rate. Higher rate allows for finer resolution but also increases the overhead. By choosing an «odd» value like 99 samples per second (instead of 100) we can avoid accidental alignment with some regular activity inside the OS which would skew the results. E.g. if there was a periodic task that performs memory bookkeeping every 10ms, every sample we take would see it.
The simplest and most reliable way to obtain a native code stack trace is to use frame pointers (
--call-graph fp), but modern compilers omit those to save a few CPU cycles per function call. Alternatively, you can compile the code with DWARF debug symbols enabled and let perf use that information to unwind the stack (--call-graph dwarf). Profiling overhead will be higher, but outside of profiling the code will run a little bit faster (having frame pointers enabled slows down execution by a single-digit percentage).
FlameGraph is a popular way to visualize this data:
- Vertically stacked rectangles represent function call stacks.
- Their width is proportional to the cumulative amount of time spent in a given function.
- Functions are colour coded to distinguish between user space Rust code, user space C code, and kernel space code execution.

Open the image in a new tab to see the interactive version.
A few things stand out in the collected CPU profile:
A lot of time is spent on decoding UTF-8 (
core::str::converts::from_utf8). This is the result of using read_line(): not only will it split the input by the new line byte, but, because the output is a String, it also has to validate the UTF-8 byte sequence, which is completely redundant in our case.The next big chunk of work is copying the data (
core::ptr::copy_nonoverlapping). BufReader normally allows to reduce the overhead from making repeated syscalls by buffering the data, so that every read operation does not need to go to the OS. But using BufReader incurs one additional data copy from its own internal buffer to the final destination in memory specified in theread_line()call.Finally, syscall overhead is noticeable (all the «orange» call frames), and we clearly spend a significant portion of time in kernel space.
How can we address those issues?
Doing less work: using raw bytes instead of text Link to heading
The first issue we identified is trivial to fix: we just need to swap String for Vec<u8>, and
use read_until() instead
of read_line(). That’s what already happens internally; we are simply removing redundant UTF-8
validation.
fn count_lines(path: &str) -> Result<usize> {
    let mut reader = BufReader::new(File::open(path)?);
    let mut lines = 0;

    let mut buf = Vec::new();
    loop {
        if reader.read_until(b'\n', &mut buf)? == 0 {
            break;
        }

        lines += 1;
    }

    Ok(lines)
}
Now «only» ~18 times slower! Still a long way to go, but we are getting there.
> time target/release/newlines /home/malor/sandbox/1brc/measurements.txt
1000000000 /home/malor/sandbox/1brc/measurements.txt
________________________________________________________
Executed in   18.37 secs    fish           external
   usr time   14.02 secs    0.00 millis   14.02 secs
   sys time    3.23 secs    1.45 millis    3.23 secs
Avoiding redundant copies Link to heading
The next problem to address would be the redundant copies from the internal buffer of a BufReader:
we can call read() on a File directly and make
the OS copy the data to our own memory buffer allocated in the same function (it does not really matter
if it’s allocated on the stack or in the heap, but we might as well use a fixed size array of bytes).
We have to implement counting of new lines ourselves now, but it’s straightforward.
fn count_lines(path: &str) -> Result<usize> {
    let mut f = File::open(path)?;
    let mut lines = 0;

    let mut buf = [0; 8192];
    loop {
        match f.read(&mut buf)? {
            0 => break,
            n => lines += buf[..n].iter().filter(|x| **x == b'\n').count(),
        }
    }

    Ok(lines)
}
Readers might question the choice of the iterators API for counting new lines, but the reality is that this code produces the exact same assembly as a handwritten loop and runs just as fast, so it makes no difference.
This is still slow, but the performance win from removing one extra copy in user space is impressive!
> time target/release/newlines /home/malor/sandbox/1brc/measurements.txt
1000000000 /home/malor/sandbox/1brc/measurements.txt
________________________________________________________
Executed in    4.88 secs    fish           external
   usr time    3.58 secs  758.00 micros    3.58 secs
   sys time    1.29 secs  254.00 micros    1.29 secs
Reducing the syscall overhead Link to heading
One important question left unanswered is how large our memory buffer has to be. If it’s
too small, then the overhead of context switches caused by repeated read() syscalls will
drive up the time spent in kernel space.
In the previous section, we chose the value 8 KiB as it matches the default buffer size
used by BufReader. But for our toy example, where we know the size of the input data
and the exact nature of the computation being performed, we can certainly do better.
We can run our program repeatedly with different values of the buffer size to determine which one works best. On my machine, I stop seeing improvements after increasing it to around 1 MiB (that happens to be the L2 cache size on Ryzen 7700).
fn count_lines(path: &str) -> Result<usize> {
    let mut f = File::open(path)?;
    let mut lines = 0;

    let mut buf = [0; 1024 * 1024];
    loop {
        match f.read(&mut buf)? {
            0 => break,
            n => lines += buf[..n].iter().filter(|x| **x == b'\n').count(),
        }
    }

    Ok(lines)
}
With that, our program already takes less sys time than wc (which happens to use 256 KiB reads according to strace), but wc remains significantly faster overall.
> time target/release/newlines /home/malor/sandbox/1brc/measurements.txt
1000000000 /home/malor/sandbox/1brc/measurements.txt
________________________________________________________
Executed in    3.92 secs    fish           external
   usr time    3.31 secs  590.00 micros    3.31 secs
   sys time    0.60 secs  259.00 micros    0.60 secs
What’s its secret then? perf to the rescue!
Profiling wc Link to heading
The wc binary shipped by Arch Linux is built with the frame pointer optimization enabled and comes without DWARF debug symbols, but the good news is that perf now supports debuginfod, so it’s easy to get a meaningful CPU profile without rebuilding the binary from the source code.
> perf record -F 99 --call-graph dwarf \
     --debuginfod=https://debuginfod.archlinux.org -- \
     wc -l /home/malor/sandbox/1brc/measurements.txt

Two things that immediately stand out:
- The majority of time is spent in kernel space on copying the data from the Linux page cache to user space.
- The name of the «hot» C function gives away the answer — wc_lines_avx2. The reason why this implementation is so fast is that it uses AVX2 SIMD instructions to process multiple input bytes in parallel.
SIMD Link to heading
Single Instruction Multiple Data is a technique used by modern processors (CPU or GPU) to parallelize data processing. It allows the processor to apply the same operation (e.g. addition or multiplication) to many data elements (a «vector») at once. What would normally require implementing an explicit loop in the code, can be done using a single instruction, which reduces the associated overhead and maximizes «goodput».
For the problem of counting new lines, instead of reading input bytes and comparing them to b'\n'
one by one, we could instead:
- Load the next N bytes into a vector register
A. - Set each byte of a vector register
Bto a numeric value ofb'\n'. - Execute the CPU instruction which performs element-by-element comparison of
AandB. - The result would be a N-bit integer that has its each i’th bit is set if
A[i] == B[i]is true. - Use the popcnt instruction to count the number of bits set.
The visualization below depicts two 128-bit registers for simplicity, but modern CPUs support arithmetic operations on vectors as wide as 512-bit.

SIMD instructions are specific to each CPU architecture, and different CPU models support different vector extensions. Compilers provide so called «intrinsic» functions to control machine code generation. A combination of compile- and runtime checks is typically is used to select the best implementation available for the given CPU.
My Ryzen 7700 is a x86-64 CPU that supports AVX-512 512-bit extensions. An SIMD optimized version of the code from the previous section could be implemented like this:
fn count_lines(path: &str) -> Result<usize> {
    let mut f = File::open(path)?;
    let mut lines = 0;

    let mut buf = [0; 1024 * 1024];
    loop {
        match f.read(&mut buf)? {
            0 => break,
            n => lines += count_lines_impl(&buf[0..n]),
        }
    }

    Ok(lines)
}

#[inline(always)]
fn count_lines_impl(buf: &[u8]) -> usize {
    // A *compile time* check that conditionally generates machine code based on the
    // target CPU architecture.
    #[cfg(target_arch = "x86_64")]
    {
        use std::arch::x86_64;

        // A *runtime* check to pick the best optimized implementation
        // supported by this CPU.
        if is_x86_feature_detected!("avx512bw") {
            let mut lines = 0;
            let (chunks, remainder) = buf.as_chunks::<64>();
            for chunk in chunks {
                let result = unsafe {
                    let newlines = x86_64::_mm512_set1_epi8(b'\n' as i8);
                    let to_match = x86_64::_mm512_loadu_epi8(chunk.as_ptr() as *const i8);

                    x86_64::_mm512_cmpeq_epi8_mask(to_match, newlines)
                };

                lines += result.count_ones() as usize;
            }

            // Use the default implementation for the very last chunk that is
            // shorter than the SIMD block size.
            lines += count_lines_default(remainder);

            lines
        } else {
            // Fall back to the default implementation if this CPU does
            // not implement AVX-512.
            count_lines_default(buf)
        }
    }

    // Fall back to the default implementation if we don't have an
    // SIMD version for this platform.
    #[cfg(not(target_arch = "x86_64"))]
    count_lines_default(buf)
}

#[inline(always)]
fn count_lines_default(buf: &[u8]) -> usize {
    buf.iter().filter(|x| **x == b'\n').count()
}
Note that:
- A runtime check is required because not all x86-64 CPUs support AVX-512.
- Even on CPUs that do support AVX-512, a non-SIMD implementation is used to process the very last, potentially incomplete 512-bit chunk of data.
- By default, rustc targets the «baseline» version of x86-64 that only supports the older 128-bit SSE2 vector extension. To make the compiler intrinsics work as expected, the target CPU has to be overridden using compiler flags like this:
> RUSTFLAGS="-C target-cpu=x86-64-v4" cargo build --release
And, sure enough, that dramatically increases performance and finally allows us to overtake wc which uses (256-bit) AVX2 instructions.
> time target/release/newlines /home/malor/sandbox/1brc/measurements.txt
1000000000 /home/malor/sandbox/1brc/measurements.txt
________________________________________________________
Executed in  677.28 millis    fish           external
   usr time   92.05 millis  401.00 micros   91.65 millis
   sys time  583.35 millis  614.00 micros  582.74 millis
The total execution time is now dominated by read() syscalls copying bytes from kernel space
to user space.
Is there a way to avoid those copies?
Memory mapped files Link to heading
The problem we are dealing with right now is that while the content of the file we are trying to read is in main memory, it’s held in kernel’s page cache, and kernel memory is by design isolated and can’t be accessed directly. The syscall interface is provided to copy the data between kernel space and user space. But copying adds overhead and consumes limited memory bandwidth. An alternative way to perform I/O, which does not require making syscalls or copying data, is using memory mapped files.
Unless you write programs for embedded systems, most computers these days use virtual memory, which allows to isolate multiple tasks running on the same machine, allocate more than the physical amount of memory available, share data between different processes, and more. The virtual memory mechanism can also be used to read or write files on storage devices.
The mmap() syscall allows to «map» the content of a file into a process virtual address space. When a process tries to read a memory address backed by a file, there are two possible outcomes:
- The corresponding memory page is not loaded. A page fault is triggered, and the CPU performs a context switch to let the operating system handle it. The kernel will then perform a read from a storage device, store the data in its internal page cache, and map the pages from the page cache into the memory address space of the process that triggered the page fault.
- If the referenced memory page already is in main memory, the read succeeds. No context switches or copies are performed.
You don’t need to hold the entirety of a file in memory all at once: the kernel will automatically load the pages as they are accessed, and evict the unused pages to reclaim space when running close to the limit of physical memory.
The programming interface is fairly straightforward:
- Open a file for reading or writing.
- Use the mmap() syscall to map the desired region of a file to the process address space. The returned value is a pointer to an array of bytes that represent the content of a file. By default, memory pages are loaded lazily.
- When you are done, call munmap() to «free» the memory space.
It is more complicated than that, of course, but for our simple «read the whole file once» use case, we can just add a helper struct like this:
use std::fs::File;
use std::io::Result;
use std::os::fd::AsRawFd;

pub struct MMap {
    addr: *const u8,
    len: usize,
}

impl MMap {
    pub fn new(path: &str) -> Result<MMap> {
        let f = File::open(path)?;

        // Load the whole file by using the range [0; file length).
        let offset = 0i64;
        let len = f.metadata()?.len() as usize;

        let addr = unsafe {
            let addr = libc::mmap(
                // Allow kernel to choose the target memory address.
                std::ptr::null_mut(),
                len,
                // Read-only mapping.
                libc::PROT_READ,
                // Copy-on-write mapping. Only matters for writes, but must be passed.
                libc::MAP_PRIVATE,
                f.as_raw_fd(),
                offset,
            );
            if addr == libc::MAP_FAILED {
                return Err(std::io::Error::last_os_error());
            }

            addr as *const u8
        };

        Ok(MMap { addr, len })
    }

    pub fn as_slice(&self) -> &[u8] {
        unsafe { std::slice::from_raw_parts(self.addr, self.len) }
    }
}

impl Drop for MMap {
    fn drop(&mut self) {
        unsafe {
            libc::munmap(self.addr as *mut libc::c_void, self.len);
        }
    }
}
and update the code to treat the content of a file as one giant slice of bytes:
fn count_lines(path: &str) -> Result<usize> {
    let f = mmap::MMap::new(path)?;
    let buf = f.as_slice();

    #[cfg(target_arch = "x86_64")]
    {
        use std::arch::x86_64;

        // A *runtime* check to pick the best optimized implementation
        // supported by this CPU.
        if is_x86_feature_detected!("avx512bw") {
            let mut lines = 0;
            let (chunks, remainder) = buf.as_chunks::<64>();
            for chunk in chunks {
                let result = unsafe {
                    let newlines = x86_64::_mm512_set1_epi8(b'\n' as i8);
                    let to_match = x86_64::_mm512_loadu_epi8(chunk.as_ptr() as *const i8);

                    x86_64::_mm512_cmpeq_epi8_mask(to_match, newlines)
                };

                lines += result.count_ones() as usize;
            }

            // Use the default implementation for the very last chunk
            // that is shorter than the SIMD block size.
            lines += count_lines_default(remainder);

            Ok(lines)
        } else {
            // Fall back to the default implementation if this CPU does
            // not implement AVX-512.
            Ok(count_lines_default(buf))
        }
    }

    // Fall back to the default implementation if we don't have an
    // SIMD version for this platform.
    #[cfg(not(target_arch = "x86_64"))]
    Ok(count_lines_default(buf))
}

#[inline(always)]
fn count_lines_default(buf: &[u8]) -> usize {
    buf.iter().filter(|x| **x == b'\n').count()
}
With all the data copies eliminated, surely we should see a performance boost?
> time target/release/newlines /home/malor/sandbox/1brc/measurements.txt
1000000000 /home/malor/sandbox/1brc/measurements.txt
________________________________________________________
Executed in  940.43 millis    fish           external
   usr time  430.18 millis    0.00 micros  430.18 millis
   sys time  506.71 millis  835.00 micros  505.87 millis
What the heck? The code is slower now! Profiling results are interesting: we spend a surprisingly
long time in kernel space on what looks like memory page accounting. Worse than that, almost half
of that overhead comes from the cleanup performed by munmap() after the main computation
completes.

What can possibly be the reason?
We need to go deeper Link to heading
To explain what we are seeing here, we might want to use a different perf command that counts
various CPU events. There are many, but, luckily for us, stat has a convenience flag -d
(can be repeated multiple times to increase the number of metrics) that selects the «important» ones.
> perf stat -d -d -d target/release/newlines /home/malor/sandbox/1brc/measurements.txt
1000000000 /home/malor/sandbox/1brc/measurements.txt

 Performance counter stats for 'target/release/newlines /home/malor/sandbox/1brc/measurements.txt':

            968.19 msec task-clock                       #    0.999 CPUs utilized
                12      context-switches                 #   12.394 /sec
                 2      cpu-migrations                   #    2.066 /sec
           210,583      page-faults                      #  217.501 K/sec
     4,720,283,260      instructions                     #    0.94  insn per cycle
                                                  #    0.40  stalled cycles per insn     (35.68%)
     5,004,488,175      cycles                           #    5.169 GHz                         (35.77%)
     1,881,894,981      stalled-cycles-frontend          #   37.60% frontend cycles idle        (35.90%)
       931,180,037      branches                         #  961.770 M/sec                       (35.91%)
        94,486,548      branch-misses                    #   10.15% of all branches             (35.90%)
     1,732,584,852      L1-dcache-loads                  #    1.790 G/sec                       (35.82%)
       164,302,885      L1-dcache-load-misses            #    9.48% of all L1-dcache accesses   (35.71%)
     1,192,798,869      L1-icache-loads                  #    1.232 G/sec                       (35.62%)
            79,460      L1-icache-load-misses            #    0.01% of all L1-icache accesses   (35.62%)
         3,661,317      dTLB-loads                       #    3.782 M/sec                       (35.63%)
         3,451,465      dTLB-load-misses                 #   94.27% of all dTLB cache accesses  (35.63%)
               134      iTLB-loads                       #  138.402 /sec                        (35.60%)
                 5      iTLB-load-misses                 #    3.73% of all iTLB cache accesses  (35.60%)
        44,668,189      L1-dcache-prefetches             #   46.136 M/sec                       (35.60%)

       0.968958803 seconds time elapsed

       0.429695000 seconds user
       0.531063000 seconds sys
Interpreting these numbers can be tricky. What looks interesting here is the high number of (data)
TLB load misses (dTLB-load-misses)
and page faults (page-faults):
TLB is a CPU cache that speeds up translation of virtual to physical memory addresses. If this mapping is not in the cache, the CPU has to do extra work to load this mapping from the main memory before it can serve the original load which triggered the TLB miss.
Page faults happen when a process tries to access a (virtual) address that belongs to a memory page which is not in the physical memory at the moment. The corresponding page may have been swapped out to reclaim space, or it may not have been (lazily) loaded yet. In our case, we know that the data already is in kernel’s page cache, so all the page faults are so called «minor» faults which don’t trigger any reads from a storage device, but the CPU still triggers an interrupt and starts executing the kernel handler which will update the task’s memory page mapping.
To rule out the overhead of interrupts we can ask mmap() to eagerly process all the pages
by passing the MAP_POPULATE flag. The kernel still has to do the same amount of internal
memory page bookkeeping, but now it can all of it once ahead of the main computation.
With that, page faults are gone (the value of page-faults is now miniscule), but the code is
even slower!
> perf stat -d -d -d target/release/newlines /home/malor/sandbox/1brc/measurements.txt
1000000000 /home/malor/sandbox/1brc/measurements.txt

 Performance counter stats for 'target/release/newlines /home/malor/sandbox/1brc/measurements.txt':

          1,046.17 msec task-clock                       #    0.999 CPUs utilized
                19      context-switches                 #   18.161 /sec
                12      cpu-migrations                   #   11.470 /sec
                80      page-faults                      #   76.469 /sec
     6,428,987,199      instructions                     #    1.16  insn per cycle
                                                  #    0.38  stalled cycles per insn     (35.51%)
     5,534,878,783      cycles                           #    5.291 GHz                         (35.51%)
     2,438,630,204      stalled-cycles-frontend          #   44.06% frontend cycles idle        (35.60%)
     1,317,902,533      branches                         #    1.260 G/sec                       (35.68%)
       139,622,363      branch-misses                    #   10.59% of all branches             (35.79%)
     2,199,307,569      L1-dcache-loads                  #    2.102 G/sec                       (35.82%)
       174,251,962      L1-dcache-load-misses            #    7.92% of all L1-dcache accesses   (35.83%)
     1,704,929,395      L1-icache-loads                  #    1.630 G/sec                       (35.82%)
            31,243      L1-icache-load-misses            #    0.00% of all L1-icache accesses   (35.84%)
         3,169,420      dTLB-loads                       #    3.030 M/sec                       (35.84%)
         2,781,578      dTLB-load-misses                 #   87.76% of all dTLB cache accesses  (35.84%)
               235      iTLB-loads                       #  224.628 /sec                        (35.74%)
               305      iTLB-load-misses                 #  129.79% of all iTLB cache accesses  (35.65%)
        30,683,024      L1-dcache-prefetches             #   29.329 M/sec                       (35.53%)

       1.047040627 seconds time elapsed

       0.275124000 seconds user
       0.762972000 seconds sys
So it must be something else.
At first glance, TLB load misses might be harder to deal with. After all, the TLB cache size is
limited, and we need to load every memory page at least once to count the new line bytes. The
reason we have so many TLB loads is because we need that many memory pages for a 13 GiB file:
the default page size on x86-64 is 4096 bytes, which gives us 13,795,355,507 bytes / 4096 bytes/page
or 3,368,007 pages.
We can’t avoid TLB load misses, but we can significantly reduce the total number of memory pages required if we increase their size. Not only it will reduce the pressure on the TLB cache, but, perhaps more importantly, it will reduce the kernel memory page accounting overhead that we observed earlier.
For this very reason, modern CPUs support multiple so called «huge» pages that can be much larger than 4 KiB; e.g. 2 MiB or 1 GiB. On Linux, there are two different ways to use huge pages:
- Explicitly allocate huge pages using HugeTLB
- Rely on Transparent Hugepages
Of these two, the latter is easier to use and does not require reserving huge pages in advance. Basically, the kernel is already trying to scan and collapse segments of 4096-byte pages in the background; it just needs advice on what regions of memory to consider. So let’s give it advice!
madvise() is a system call that allows us to tell the kernel how the memory mapping should be used. There are various options to choose from, but the ones we care about are the following three:
MADV_SEQUENTIAL: Expect pages to be referenced in the sequential order. This is what enables page prefetch to amortize page fault overhead.MADV_HUGEPAGE: Enable Transparent Huge Pages for pages in the specified range. This is what makes the kernel consider pages in this range suitable for collapsing. It may or may not be required depending on the system configuration (only needed if/sys/kernel/mm/transparent_hugepage/enabledis set tomadviseinstead ofalways).MADV_COLLAPSE: Perform a best-effort synchronous collapse of the native pages mapped by the memory range into Transparent Huge Pages.
pub struct MMap {
    addr: *const u8,
    len: usize,
}

impl MMap {
    pub fn new(path: &str) -> Result<MMap> {
        let f = File::open(path)?;

        let len = f.metadata()?.len() as usize;
        let offset = 0i64;

        let addr = unsafe {
            let addr = libc::mmap(
                std::ptr::null_mut(),
                len,
                libc::PROT_READ,
                libc::MAP_PRIVATE,
                f.as_raw_fd(),
                offset,
            );
            if addr == libc::MAP_FAILED {
                return Err(std::io::Error::last_os_error());
            }

            libc::madvise(addr, len, libc::MADV_SEQUENTIAL);
            libc::madvise(addr, len, libc::MADV_HUGEPAGE);
            libc::madvise(addr, len, libc::MADV_COLLAPSE);

            addr as *const u8
        };

        Ok(MMap { addr, len })
    }
}
From my experiments, MADV_COLLAPSE is the «secret sauce» required to make the kernel use huge pages
consistently. While the documentation explicitly says that madvise() operates on the current state
of memory, at least on Linux 6.16 the effects persist across multiple program runs: the page cache will
use huge pages for the contents of a file that was previously mapped that way. Curiously, this also
makes wc, which does not use memory mapped IO, run faster (presumably, because page access and copying
data become more efficient).
At last, the time spent in kernel space is down to the bare minimum, and all the CPU effort is spent on the actual computation.
> time target/release/newlines /home/malor/sandbox/1brc/measurements.txt
1000000000 /home/malor/sandbox/1brc/measurements.txt
________________________________________________________
Executed in  278.52 millis    fish           external
   usr time  268.64 millis  474.00 micros  268.16 millis
   sys time    8.97 millis    0.00 micros    8.97 millis
perf indicates a significant reduction in the number of cycles, instructions, page faults, and TLB load misses across the board (which makes sense, as we now have 512x fewer 2-MiB memory pages):
> perf stat -d -d -d target/release/newlines /home/malor/sandbox/1brc/measurements.txt
1000000000 /home/malor/sandbox/1brc/measurements.txt

 Performance counter stats for 'target/release/newlines /home/malor/sandbox/1brc/measurements.txt':

            279.76 msec task-clock                       #    0.998 CPUs utilized
                 4      context-switches                 #   14.298 /sec
                 2      cpu-migrations                   #    7.149 /sec
             6,514      page-faults                      #   23.285 K/sec
     1,045,862,830      instructions                     #    0.70  insn per cycle
                                                  #    0.08  stalled cycles per insn     (35.68%)
     1,484,131,395      cycles                           #    5.305 GHz                         (35.66%)
        78,465,462      stalled-cycles-frontend          #    5.29% frontend cycles idle        (35.69%)
        45,345,238      branches                         #  162.088 M/sec                       (35.67%)
         1,664,981      branch-misses                    #    3.67% of all branches             (35.66%)
       453,704,301      L1-dcache-loads                  #    1.622 G/sec                       (35.72%)
       156,318,813      L1-dcache-load-misses            #   34.45% of all L1-dcache accesses   (35.75%)
        21,781,967      L1-icache-loads                  #   77.861 M/sec                       (35.74%)
            12,435      L1-icache-load-misses            #    0.06% of all L1-icache accesses   (35.73%)
            37,436      dTLB-loads                       #  133.817 K/sec                       (35.75%)
            13,746      dTLB-load-misses                 #   36.72% of all dTLB cache accesses  (35.73%)
                 0      iTLB-loads                       #    0.000 /sec                        (35.73%)
                39      iTLB-load-misses                                                        (35.73%)
        20,020,663      L1-dcache-prefetches             #   71.565 M/sec                       (35.75%)

       0.280205778 seconds time elapsed

       0.263825000 seconds user
       0.013880000 seconds sys
Notably, the time spent in user space increased compared to the version of this program
that used read() syscalls and performed an extra copy of data from kernel space to user space.
My interpretation is that:
- One way or the other we need to load the data from main memory at least once.
- When the syscalls interface is used, this load is performed when the data is copied from kernel space to user space, and then the data is highly likely to remain in the CPU cache, so the time spent is attributed to the kernel.
- When the memory mapped interface is used, the CPU instruction which needs the data (in our case, the SIMD integer comparison) will have to bear the cost.
Are we there yet? Link to heading
As we work on those performance optimizations, one question to ask is how do we know that we have found the optimum solution? To answer that, we need to think about what the «speed of light» of this program would be:
- We know that we are not reading data from persistent storage, so we are not limited by SSD/HDD throughput.
- Even if our CPU was infinitely fast, we would still need to load the data from main memory. Therefore, the ultimate limiting factor must be memory bandwidth.
I’ve used pmbw to empirically measure memory bandwidth on my machine. This little tool performs a series of tests to understand how throughput of reads (or writes) scales with the number of threads and the size of input data.
E.g. let’s run the test which performs 256-bit sequential reads from byte arrays of increasing size, and measure the resulting memory bandwidth as we change the number of threads that perform these reads in parallel. The results look quite intriguing:
Each line in this graph represents an independent test run with the number of parallel threads set to
p. In my case,pvaries from 1 to 16, which is the maximum number of hyper-threads on the 8-core Ryzen 7700 CPU.
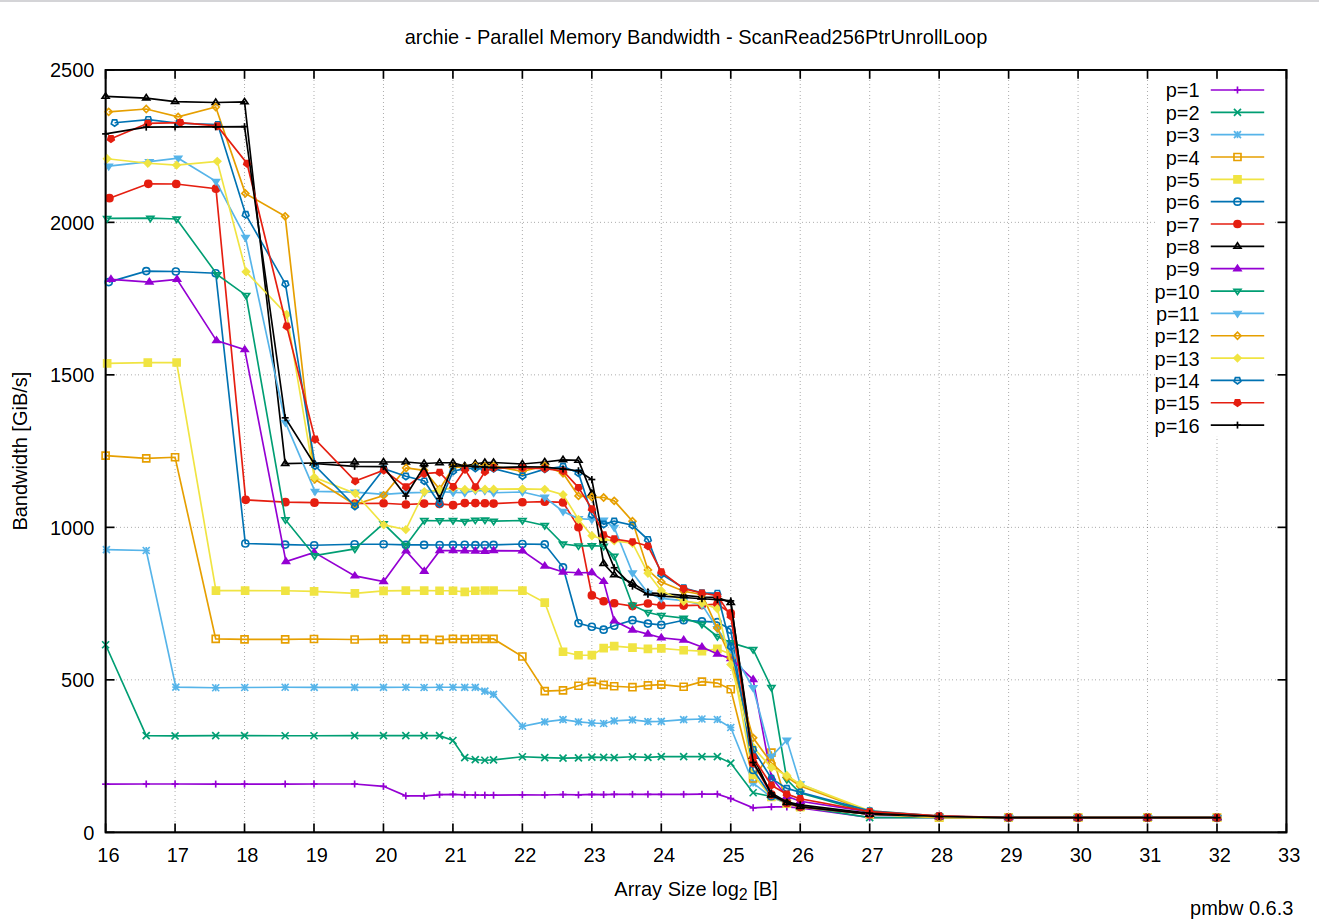
There are multiple inflection points that correspond to the next array size which no longer fits in the L1, the L2 or the L3 CPU cache.
When the total data corpus is fully in the CPU cache (regardless of the level), memory bandwidth scales linearly with the number of threads.
Once CPU has to fetch data from main memory, though, memory bandwidth becomes the bottleneck. And not only that, but we also get no benefit whatsoever from running more than one thread.
What’s also interesting about these results, is that when the data is too big to fit in any level of the CPU cache, the total memory bandwidth eventually converges around the value we are seeing in our program counting new lines (13,795,355,507 bytes / 0.280 seconds ~= 46 GiB/s):
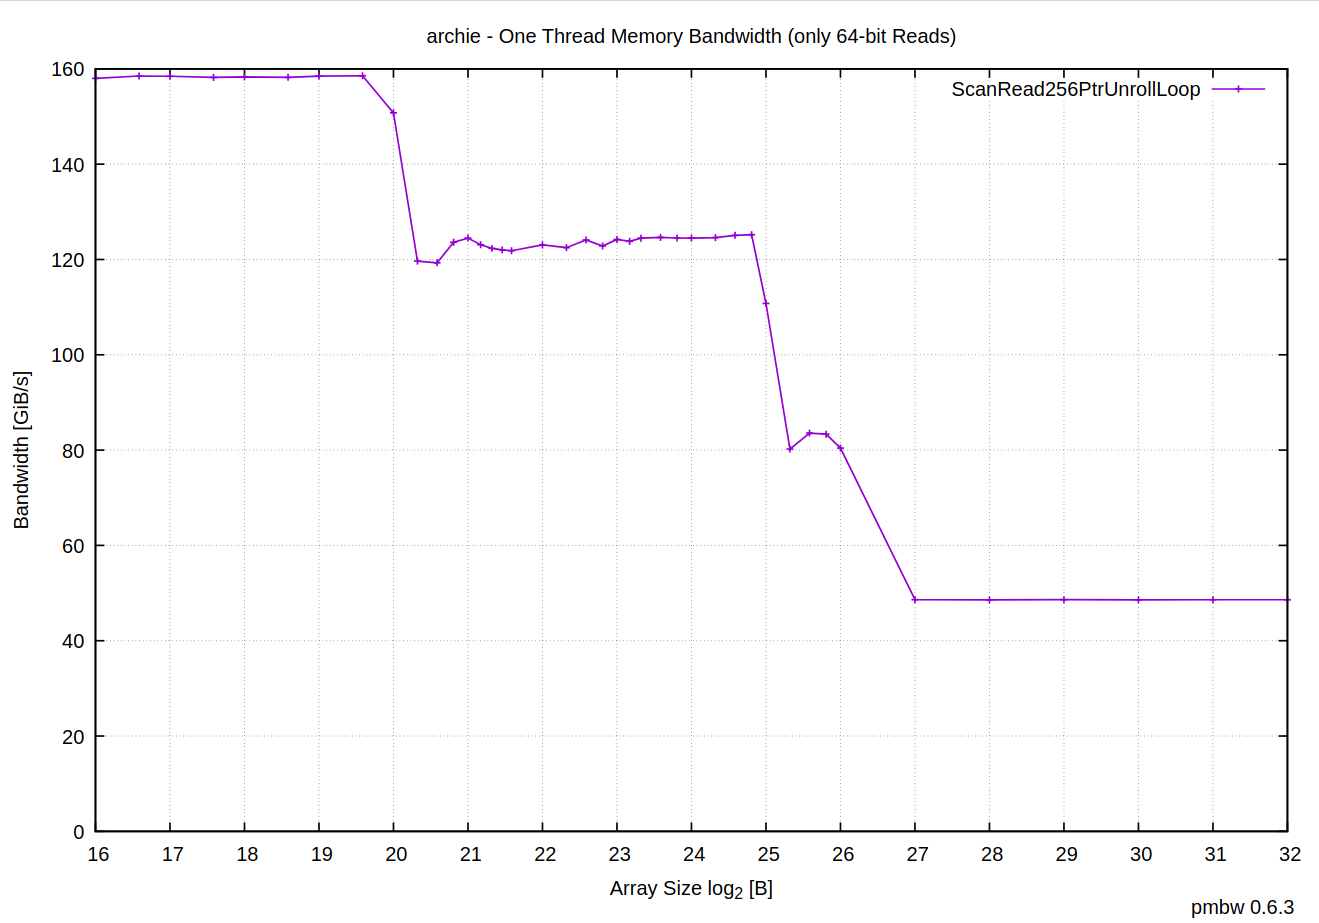
Memory bandwidth is a shared resource, and, apparently, this is the best RAM can do on my machine. The computation is so simple that CPU is able to do more, but we can’t feed the data fast enough to keep it busy. With just one thread we’ve managed to saturate the memory bus.
Curiously, theoretical throughput of these DDR5-4800 DIMM modules is supposed to be 2 channels * (4800 * 10^6) transfers/s * 8 bytes ~= 71.5 GiB/s, but, somehow, what we see in practice is much lower than that.
Conclusion Link to heading
The One Billion Row Challenge is a fun exercise that can easily send you on a quest of learning performance optimization techniques, CPU profiling, SIMD instructions, and even systems programming!
Modern CPUs are capable of crunching numbers at incredible speed if you can feed the data promptly and avoid redundant copies, unnecessary user/kernel space context switches, and other forms of overhead.
Peeling through the layers of abstraction can be hard, but we now have great tools like perf that give you access to a variety of software/hardware performance counters which can help you understand the results you are seeing and identify the bottlenecks (though, interpreting those counters is also challenging).
Memory mapped I/O is not always faster than syscalls, but it’s definitely worth considering if you have data that fits in memory (e.g. large ML models or database indexes). Huge pages are a must for achieving good performance.
More and more often, memory bandwidth becomes the bottleneck, especially on systems with high number of cores. It’s a shared resource that does not scale with the number of CPU cores. Faster memory and bigger caches can help to an extent, but on the software side of things it’s crucial to avoid unnecessary data copies to improve efficiency.